Bangladesh Import Bill Rises on Cost Factors Rather Than Volume: Analysis
Financial Express analysis reveals rising import costs driven by global commodity prices, not increased volumes

Does the sharp rise in imports of goods last fiscal year (FY26) reflect a rebound in investment in Bangladesh? The short answer, based on a careful reading of Bangladesh Bank and customs data, is no. Though the rise in imports is often linked to investment activity, several other indicators must be considered before drawing that conclusion — and on those indicators, the country's investment climate remains subdued.
Growth of domestic credit, for instance, is a key gauge of the domestic investment trend, and the export trend serves as another. Decomposing imports by value and volume is also necessary to understand the link to investment, especially when monthly or quarterly data on domestic investment is not available. On each of these tests, FY26's import surge looks far more like a cost-driven phenomenon than a genuine investment rebound.
Statistics from Bangladesh Bank showed that credit to the private sector grew modestly by 4.47 per cent at the end of FY26 — the lowest level in the country's history, according to a media report. Total outstanding loans to the private sector stood at Tk 18.26 trillion at the end of June, up 4.47 per cent from Tk 17.48 trillion a year earlier. If there were robust investment demand, credit growth would be much higher; the stagnation instead suggests that businesses remain cautious about committing fresh capital.
The stagnation in export growth in FY26 also underscores the gloomy investment situation. Earnings from exports stood at $48.38 billion in FY26, down from $48.70 billion the previous year, according to data available with the customs authority. Though export performance largely depends on global market conditions, domestic factors like the lack of increased investment are also important.
Against this backdrop, the headline import growth figure needs context. Overall imports of goods in FY26 reached $75.20 billion, growing 10 per cent from $68.40 billion in FY25 — the first double-digit growth in three years. Central bank statistics showed imports increased by only 2.40 per cent in FY25, following an 11.10 per cent decline in FY24. The FY26 jump, however, was mostly driven by rising prices in international commodity markets rather than by rising volumes of capital machinery or industrial inputs.
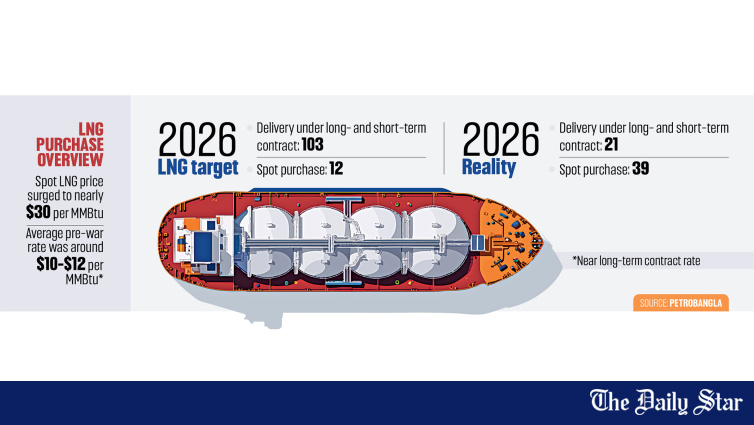
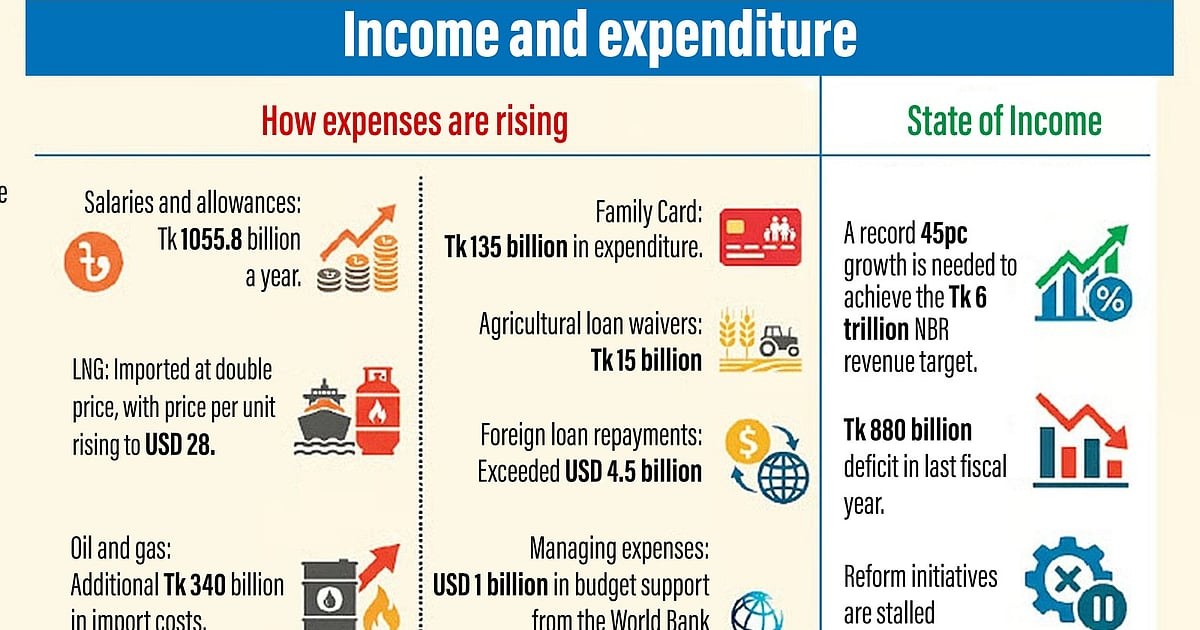
Nowhere is this clearer than in petroleum. The cost of importing petroleum goods jumped by 107 per cent in FY26, with the import bill rising to $10.63 billion from $5.14 billion. The US-Israel joint war against Iran, initiated in February 2026, pushed the global price of crude oil sharply upward. Due to the war in Iran, shipments through the Strait of Hormuz were heavily disrupted, and oil imports from the Middle East have been near zero since March. Instead, the country has had to purchase oil and LNG from spot markets, making those more expensive. The Hormuz closure drove JKM spot LNG prices above $35/MMBTU at one point — roughly triple the 2022 benchmark price. Last fiscal year, the volume of LNG imports stood at 5.1 million tonnes. Petroleum products accounted for 14 per cent of overall goods imports in value terms last fiscal year, up from 7.52 per cent in the previous fiscal year.
The fertiliser import bill jumped 42 per cent last fiscal year to $3.72 billion from $2.62 billion in FY25. Though the volume of imported fertiliser increased modestly to 5.10 million tonnes from 4.44 million tonnes, the global rise in fertiliser prices inflated the import bill. The Iran war pushed urea prices to $700 per tonne in March 2026, up from the pre-crisis level of $290–$320; the price declined to around $360 by late June. Around 5 per cent of the total import bill was fertiliser payments last fiscal year.
A sharp increase in wheat imports also drove the foodgrain import bill higher, while rice imports declined modestly. The wheat import bill reached $2.04 billion, up 26 per cent from $1.63 billion the previous year. The volume of wheat imports — Bangladesh's second most-consumed cereal — stood at 7.33 million tonnes, up from 6.14 million tonnes. In recent years, the country has seen growing demand for wheat in bakery, processed foods and animal feed, and changes in food habits, such as increased bread consumption, have also raised demand.
In contrast, there was a decline in imports of RMG-related intermediate goods, such as raw cotton and yarn, reflecting subdued demand for industrial raw materials linked to lower export activity. Overall exports were almost stagnant, with knitwear exports declining around 2 per cent last fiscal year and exports of woven garments increasing by less than 1 per cent. In other words, there was almost no additional demand for raw materials and intermediate goods for the country's largest export-oriented industry, and new investment was thin.
Coal imports jumped to 20.71 million tonnes — for use in coal-fired power stations — making it the top imported product by volume, followed by clinker, the essential raw material for the cement industry, at 19.20 million tonnes worth $918 million. Together, these bulk commodities underscore how the FY26 import surge was dominated by energy and construction inputs, not by capital machinery for new industrial capacity.
The cost-driven surge in imports, coupled with lower investment demand, did not put foreign exchange reserves under pressure. By year-end, reserves were adequate to cover five months of import payments. For import payments of goods and services, reserves would cover four and a half months. Foreign exchange reserves stood at $32.90 billion under IMF BPM6, while gross official reserves were $37.58 billion — a figure the central bank still uses to estimate months of import coverage, providing what economists describe as a misleading comfort zone.
Besides imports of goods, imports of services increased by 2.60 per cent to $12.80 billion in FY26. There was a significant 21 per cent surge in payments for travel-related services, while transport-related services declined by around 9 per cent. Payments for international transport services — accounting for 55 per cent of total imports of services — stood at $7.0 billion, followed by travel services worth $2.0 billion. Together, imports of goods and services stood at $88 billion in FY26, around 9 per cent higher than $80.8 billion in FY25. The amount is, however, not very large: the ratio of imports of goods and services to GDP is almost constant at 16 per cent on average for the last couple of years — a reminder that the FY26 import surge was a price story, not a volume story, and certainly not an investment rebound.
This news was originally published by The Financial Express. For the full original report, please visit: https://thefinancialexpress.com.bd/columns/cost-driven-rise-in-import-bill
📬 Get Bangladesh Trade News in your inbox
Weekly digest of export industry news, policy updates, and market analysis.
📰 Related Stories